


Conventional wisdom tells us that views, especially three-seconds ones, are a vanity metric. But Facebook tracks them for a good reason.
In 2016, they analyzed their users’ video consumption data and discovered that 45% of people who watch the first three seconds of a video will keep watching it for at least 30 seconds. Facebook’s study suggests that views are a good indicator of how well your video’s hook performed. But views also have drawbacks, like not being able to tell you who your audience is or whether your video resonates with your audience.
That’s why we created this list of YouTube and Facebook video metrics that’ll shed light on the things your boss actually cares about, like how much your audience engages with your video, what video topics they crave, and how video affects your website’s performance. Read on to learn more.
16 Video Metrics Your Boss Actually Cares About
1. Watch Time
Watch time is the total amount of time viewers have spent watching your video. It measures how long your viewers engage with your video. YouTube accounts for watch time, not views, when they rank videos for search and feature videos in the related section, so you should try to engage your viewer with a compelling story for as long as possible.
2. Average View Duration
Average view duration is the total watch time of your video divided by the total number of video plays, including replays. It measures how long your viewers watch your video, on average. Average view duration is a powerful metric because it reveals your audience’s video length preference. For instance, if your 45 second videos keep getting a 30 second average view duration, you might want to cut those videos down by 15 seconds.
3. Average Completion Rate
Average completion rate is the percent of each video your audience watches. This metric measures your video’s ability to hold attention. Facebook uses average completion rate to rank videos in users’ news feed, so it’s crucial for your Facebook videos to engage viewers from start to finish.
4. Audience Retention
Audience retention shows you the percentage of your audience that keeps watching a video as it plays from beginning to end. Facebook and YouTube will display your video’s audience retention on a graph, like the one below:
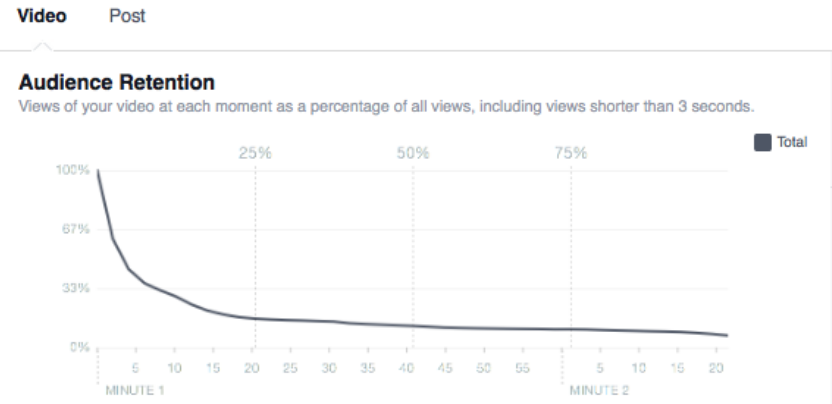
Image Credit: Facebook
Drops in the retention curve help you understand when your audience stops watching your video. If there’s a sudden drop off at a certain point in your video, you should analyze what’s happening at that specific time. You’ll learn what’s causing viewers to bounce, like a certain part or previous parts of the video not piquing their interest.
In addition to displaying your video’s audience retention, YouTube will display your video’s relative retention, which compares your video’s ability to retain viewers to all YouTube videos of similar length.
5. Re-watches
Re-watches are the amount of times your audience watches your entire video or specific parts of your video again. If a lot of people are re-watching a certain part of your video, which the orange part of the graph below represents, they’re probably interested in the topic your video is covering during that moment. And by using re-watches to determine which topics resonate with your audience, you can refine your video strategy by making videos about these topics.
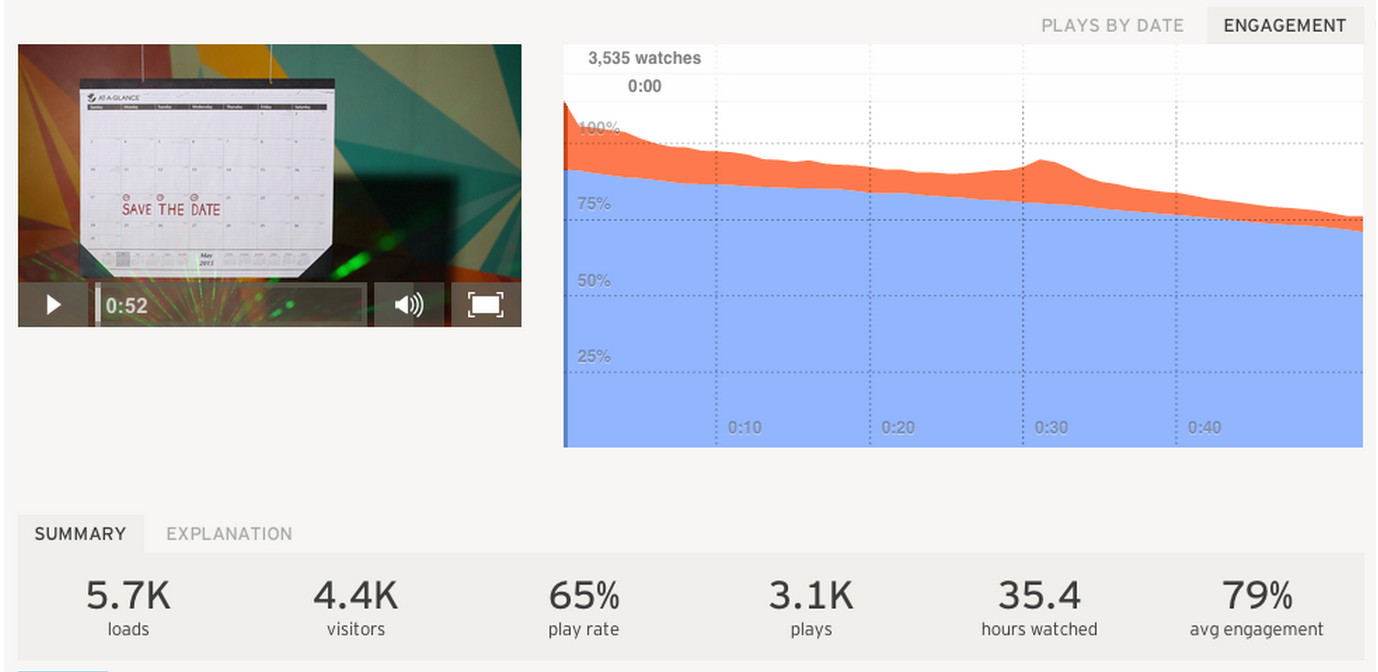
Image Credit: Harvard Business Review
6. Click-Through-Rate
Click-Through-Rate measures how well your video encourages viewers to take a desired action. If your CTR is low, consider altering your call-to-action’s placement in your video. Audience retention graphs show that most people don’t watch videos all the way through, so you could place your CTA at the beginning or middle of your video. Or you could also make your video more engaging, so more viewers reach the CTA at the end of your video. Leaving your CTA at the end could produce more clicks than moving it to the middle or beginning because viewers who watch your video all the way through are more likely to take an action than someone who just clicked play.
7. Engagement
According to Facebook, likes, comments, and shares are the best measure of how well a video resonated with your audience. Engagement is also one of the most important factors in boosting your video’s organic reach — if a video resonates well with part of your audience, then Facebook concludes that it’ll resonate with the rest of your audience.
Engagement provides marketers with valuable qualitative data too. Comments can show you the emotional affect your video had on your viewers. Do they seem inspired? Or are they angry you covered a controversial topic? This data can help you decide which video topics to focus on in the future.
Social shares can paint a clearer picture of your audience’s brand affinity and loyalty. This metric measures how much your audience values your content and brand. It also builds your brand’s credibility. Since people share content that confirms their ideal self-persona, people who share your video are willing to show their community that they trust and support your brand.
Social sharing is also one of the best forms of word-of-mouth marketing. According to Facebook, 48% of all video watch time can be attributed to social sharing.
8. Negative Feedback
On Facebook, negative feedback is how often people hide your video, report it as inappropriate, or unlike your page after watching it. The videos with the highest amount of negative feedback can help you nix ineffective topics from your content mix.
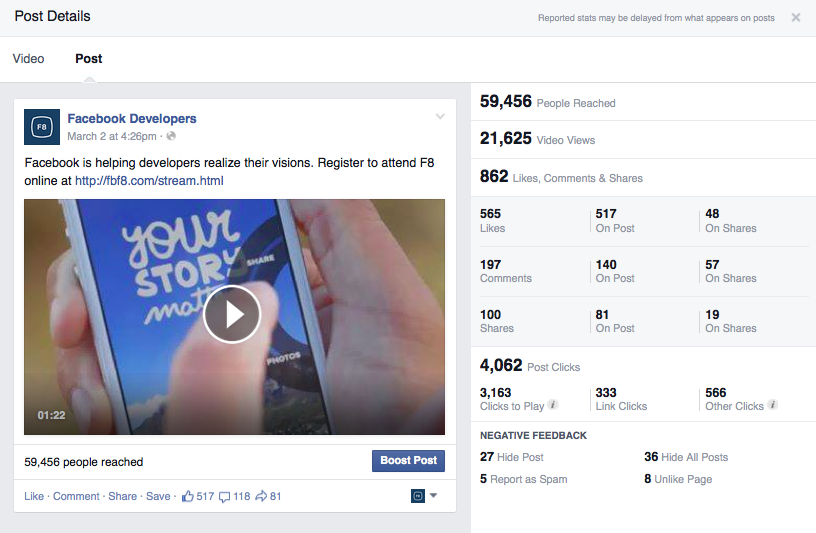
Image Credit: Facebook
9. Subscriber and Fan Growth
YouTube’s subscriber report will show you which videos gain or lose subscribers, the geographic location of your gained or lost subscribers, and the dates that users subscribe or unsubscribe from your channel. This data is valuable because it can inform your video strategy tremendously. You’ll learn what topics resonate with your subscribers the most and where to target new subscribers.
Subscribers are important to your channel because YouTube will send them notifications about your new videos and feature your videos on their homepage. This means they’ll see your videos more frequently, which will help you generate more views. Subscribers also tend to watch your videos longer than non subscribers, so the more subscribers you have, the more watch time your videos will collect, and the more likely they’ll rank on search and be featured in the related section.
On Facebook, you can see how each of your videos influences your page’s fan growth. This’ll help you determine which video topics resonate with your viewers the most.
10. Top Location & Audience
Your Facebook videos’ top location and audience will help you flesh out your personas and target more precisely when you want to boost your videos. This data helps you discover your most loyal, engaged Facebook audience.
For instance, if your top audience is male, age 35-44, and your top location is Missouri, you can target this audience with future videos, which will grow your Facebook following and boost your videos’ engagement and organic reach.
11. Peak Live Viewers
Peak live viewers shows you when the highest number of viewers were watching your Facebook live video. If a video’s live peak is early, then drops off, the beginning of your video might not be that engaging, leading to your viewers’ drop off. This data will help you adjust accordingly for your next live video stream.
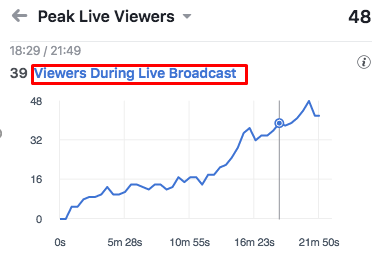
Image Credit: Sprout Social
12. Reactions
Facebook will display a distribution of your audience’s reactions during your live video streams. This lets you determine the emotions each part of your video evoked, revealing which topics evoke which emotions and leading you toward a more data-driven live video strategy.
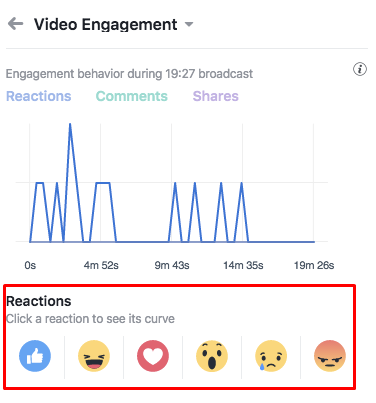
Image Credit: Sprout Social
13. Play Rate
Play rate is how many people play your video divided by the number of people who visit the page that hosts your video. If the page’s play rate is low, your video probably isn’t relevant to the topic of your page. A low play rate can also illuminate other problems with your marketing, like your copy not being able to entice visitors to watch your video, the video not being embedded in the right place on the page, or your visitors preferring text over videos when they learn.
14. Bounce Rate
A webpage’s bounce rate is the percentage of people who land on it, but then leave without going to other pages. On your website, most videos should guide your visitors to click on a CTA or explore other pages, like a visitor watching a video on the product page and then navigating to the pricing page. If your videos make your prospects leave your website entirely, then they’re probably not engaging or enticing enough.
15. Conversion Rate
Your video’s conversion rate measures how well your video persuaded viewers to convert into a lead or a customer. You should test whether videos increase or decrease your landing or product pages’ conversion rates. If they do, this means video does a better job of conveying information and evoking excitement in your prospects than text does.
16. Who Watches Your Video
When you can track which contacts in your database are watching certain videos on your website, it gives you a lot of context on what their pain points are and how you can solve for them. Your marketing team can send them content related to the video topics they watch, and your sales team will know exactly how to help them. You can also move these contacts down your inbound funnel. If a prospect just watched a case study video, you can send them a product overview video the next day.


Deje su comentario